These views are intended for use in debugging and profiling the Tixati software. Most users will not need to use these features. However, since they don't change any settings or affect any other part of the program, feel free to explore them.
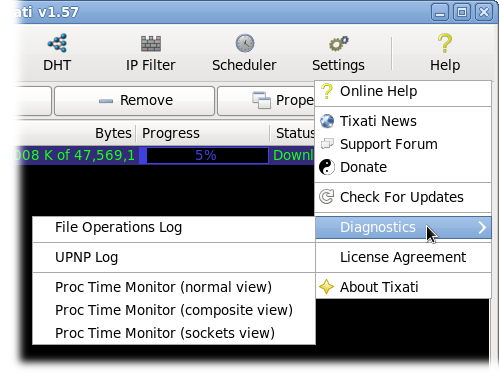
Access the diagnostic views by clicking the main Help button in the top-right corner of the main window:
File Operations Log
This log includes all file accesses by Tixati from the time when the log view is opened. The last us= parameter is the time the system call takes to complete in microseconds.
UPNP Log
This shows details of Universal Plug n Play transactions. UPNP is used to automatically map an incoming port through a broadband router. It is only functional if it is activated in
Settings - Network - Incoming Ports. It must also be supported by your broadband router. For more information, see
Step 2 in the Optimizing Tixati Guide.
Proc Time Monitors
These show the amount of CPU time spent within various sections of the program. The top chart is the total proc entry-exit time in microseconds, and the bottom chart is the cycle count per second.